


The most popular incorrect chart: The disconnect between pay and productivity
The disconnect between economic reality and perceptions seems to be stronger than ever. We have had a two-year long vibecession on our hands even as the labor market has been one of the best in recent decades. Workers had the pick of the lot when it came to available jobs. Yes, inflation was high, but so was wage growth.
Even as the world has been constantly improving in recent decades, lifting billions of people out of poverty, there seems to be a lot of denial in advanced economies that the world is making progress.
Unfortunately, the misconception is often being spread by the media. Doom and gloom just sell better than rainbows and sunshine.
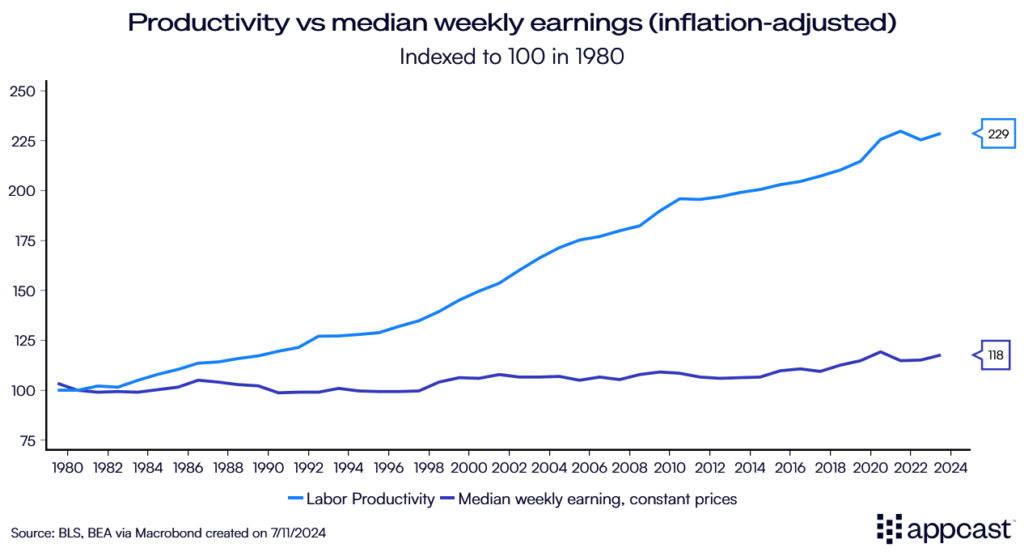
One of the more popular charts showing the apparent stagnation and malaise of the American middle class that is constantly being shared online is the one below.
The data from the Bureau of Labor Statistics (BLS) seemingly displays the massive disconnect between worker productivity and real pay (compensation adjusted for inflation) in the U.S. The implication, of course, would be that regular Americans have not benefited at all from the economic growth that has been generated in recent decades.
While American workers are more than twice as productive as in 1980, real pay has gone up by less than 20% according to this metric. If that were true, it would be a massive problem indeed. However, the chart below does not reflect the reality that workers have experienced.
There is a massive gap between different inflation measures
The main problem is that the BLS relies on an inflation measure that overstates inflation when calculating real wages, which they admit, by the way. Consequently, any long-run measure for inflation-adjusted earnings coming from the BLS should be taken with a massive grain of salt!
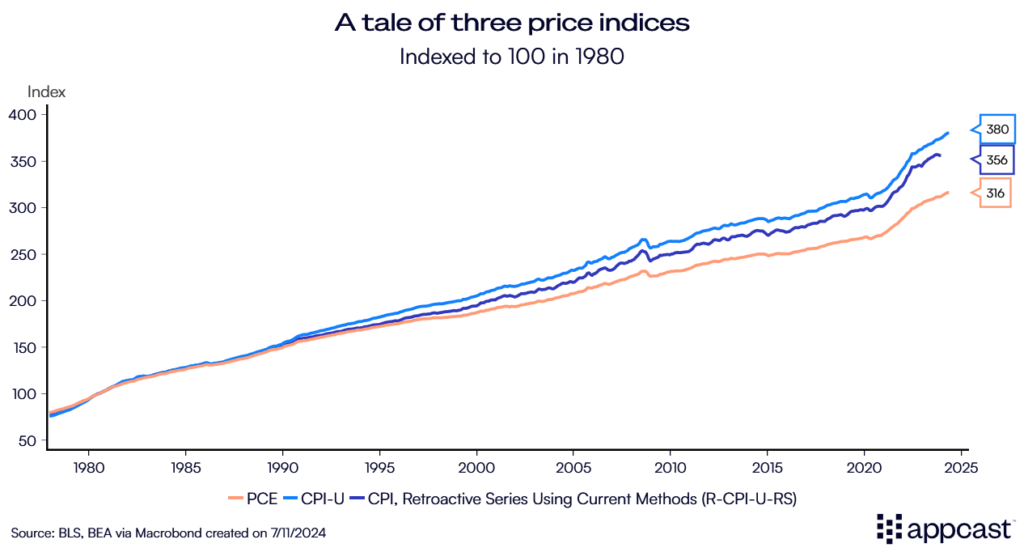
The chart below illustrates the problem by showing inflation using three different measures, the Consumer Price Index for Urban Consumers (CPI-U), the retroactive CPI measure (R-CPI-U-RS) and the index for Personal Consumption Expenditure (PCE).
The discrepancy between the three series over time is relatively stark. While CPI is up by about 280% from1980, the retroactive CPI measure and the PCE index are up by less than 260% and 220%, respectively.
Why are there massive difference between the inflation measures?
The CPI measures the change in prices paid by urban consumers (CPI-U) for a fixed basket of goods and services. Various improvements have been made to how inflation is measured. For example, the BLS has adjusted its methodology on how the price of shelter, drugs, vehicles, TVs, and various other items are computed over time.
While these improvements make the present and future CPI more accurate, historical price index series are not adjusted to reflect the improvements. The retroactive CPI series (R-CPI-U-RS) is an attempt to measure inflation consistently over the entire period.
As one can see from the chart above, using this retroactive series instead leads to a lower price level increase over time between 1980 and today (the difference is close to seven percent).
But this is not all. Even the retroactive CPI series probably overestimates inflation. America’s central bank, the Federal Reserve, does not actually target the CPI but uses the Personal Consumption Expenditure Index (PCE) instead.
Economists have long argued that the CPI is upward biased by about 0.3 to 0.4 percentage points each year, according to the Boskin report. The study outlines that CPI might overstate inflation by about 0.8 to 0.9 percentage points each year, split over three attributes: 0.3–0.4 points are attributable to failing to account for substitution among goods (consumers switching to less expensive products like going from organic to regular peanut butter); 0.1 for failing to account for substitution among retail outlets (going to Aldi instead of Whole Foods); and 0.4 for failing to account for new products.
Boskin points out that the first 0.8 or 0.9 percentage points of measured CPI inflation are therefore not really inflation at all.
The PCE index, on the other hand, allows for changes in consumer behavior and substitution between goods, therefore more accurately reflecting consumers’ lived experienced.
It is a broader measure for consumer spending because it includes spending on behalf of households by third parties as well (employer-paid health insurance and medical care financed through government programs, life insurance expenses, and pension plan expenses, for example).
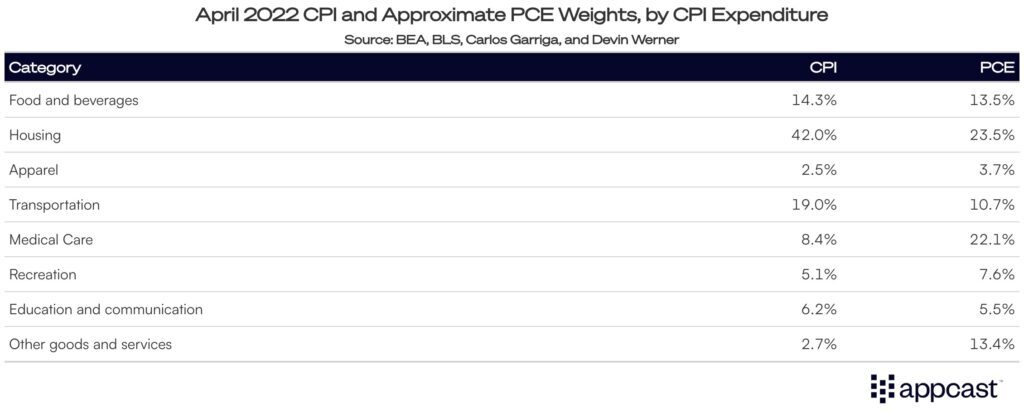
The CPI and PCE also differ in how much weight each item has in the “consumer basket”. The CPI has a much higher share of housing and transportation while the PCE puts a higher weight on medical care. And while the CPI weights are only updated every two years, the PCE basket is updated every month.
For all these reasons, America’s central bank therefore targets an inflation rate of two percent according to the PCE index and not the CPI.
What does that mean for real wages?
First and foremost, it means that any real wage data published by the BLS needs to be taken with a grain of salt. The BLS uses the CPI-U measure to deflate nominal wage data.
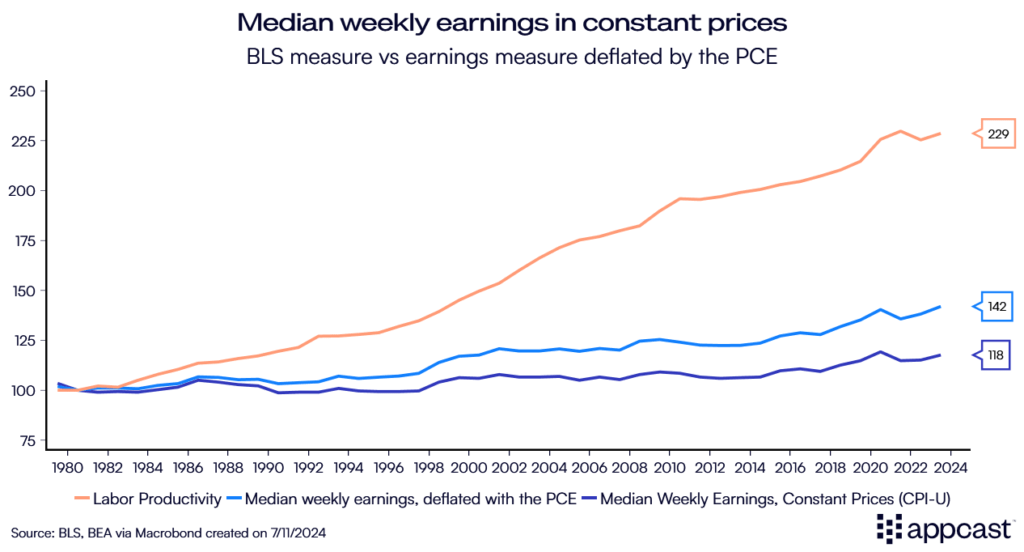
However, as the lengthy explanation outlined above hopefully demonstrates, CPI-U overestimates true inflation, probably quite substantially. Using the PCE measure preferred by the Federal Reserve means that real wages have gone up by about 42% since 1980 instead of the meager 18% suggested by the BLS, a sizeable difference!
While the gap between earnings and productivity remains large, it is not as big as many have suggested. One should also keep in mind that companies nowadays offer many benefits that as part of the compensation package. These include pension contributions, health and dental care, parental leave, working from home, discounts to gym memberships and various other products, and other benefits. Wage data therefore does by no means capture the full scope of what employees receive from their employers.
What does that mean for recruiters?
Economic data can be misleading at times and context is important. The BLS is a trusted statistical agency in the U.S. that releases some of the most important economic data in the country, including the nonfarm payroll report (based on the CES survey) as well as employment and unemployment data (based on the CPS survey).
Unfortunately, all the data on inflation-adjusted wages that the BLS releases uses the CPI-U as benchmark. The reason for doing do so seems to be about historical consistency rather than anything else.
However, the CPI-U is a somewhat flawed measure of inflation since it overestimates the price changes that consumers actually experience by a large amount. The Federal Reserve, the agency responsible for targeting America’s inflation rate, does not rely on the CPI-U but uses the PCE index instead.
When the media, workers, and even some economists are pointing out that real wages have performed abysmally in recent decades and that companies are not compensating their workers enough, the truth is that this reasoning is based on flawed data points.
The BLS would do well to release separate series for real wages that use the more reliable PCE index to adjust for inflation. As of now, the BLS is contributing to the perception that the last decades have been horrible for workers even as the reality is quite different.