


The road to the Federal Reserve’s goal of 2% inflation has been long and winding, and it seems it will continue that way.
The cooling in the economy has contributed to softer price increases in the headline numbers, but inflation remains fairly stubborn. April’s numbers showed that inflation was moving sideways, neither accelerating or decelerating. From this time a year ago, headline inflation is up 4.9%. Month-over-month, headline inflation increased 0.4%. Core inflation rose at a faster pace, up 5.5% from this time last year.
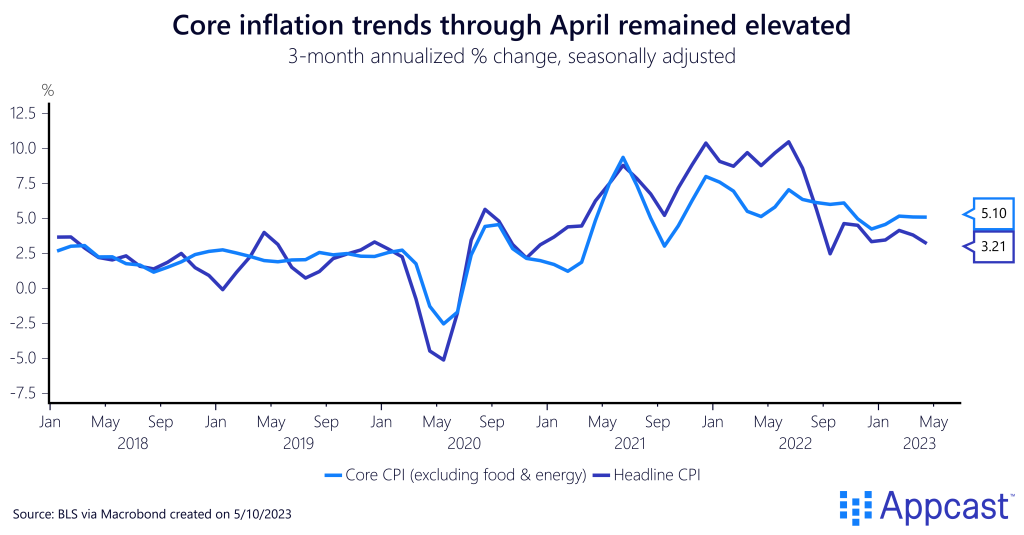
Looking at annual rates in the three months through April, core inflation – excluding food and energy prices – seems stubborn. Over that period, core prices were up 5.1% – holding flat at an elevated level that could suggest entrenched inflation. And while headline inflation decreased strongly near the end of 2022, that slowing trend has not been as strong in 2023.
Once again, the usual culprits contributed to elevated prices in April – the index for food was up 7.7% from the year before, though it did not grow month-over-month. Shelter, a large contributor to core inflation, refuses to budge, rising 8.1% from the year before.
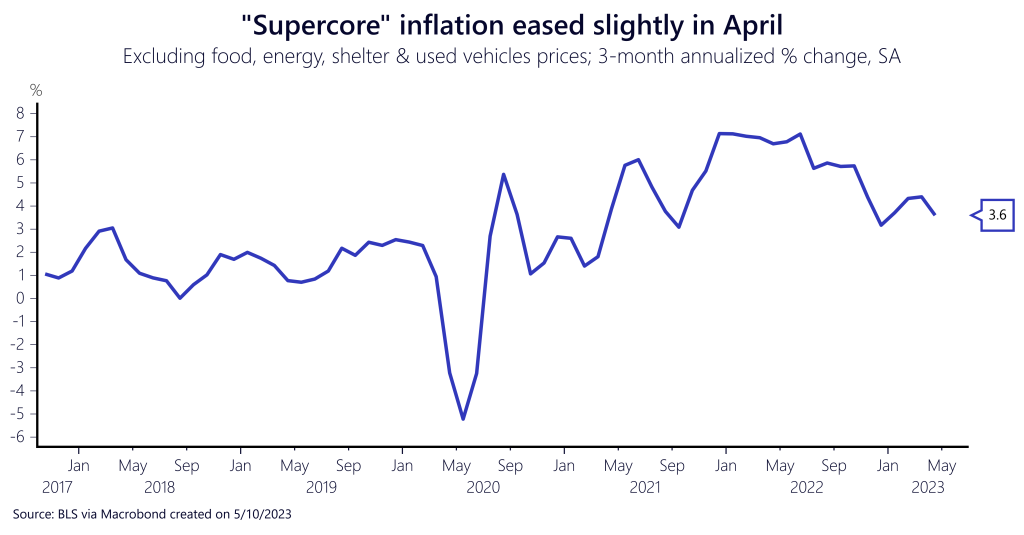
Because of the lags in the shelter index, honing in on the true increases of service prices requires an even narrower index – supercore inflation. The Federal Reserve has been paying close attention to this index, which is stripped of food, used vehicles, energy, and shelter, as it gives an idea of how stubbornly-high wage growth in the services sector is feeding into inflation. In April, the three-month annualized rate dipped slightly to 3.6% – a fairly unremarkable decrease considering the increase seen the month before. American consumers are still suffering from too-high service prices.
The long road to 2% inflation
The U.S. economy is well into the journey to 2% inflation – just consider the levels of inflation seen in the summer of 2022 versus now. The economy has come a long way – the labor market is cooling (very slightly), wage growth has moderated slightly (though remains too high for the Federal Reserve’s liking), and consumer spending plateaued in the most recent reading (though Americans are still spending strongly on travel and leisure). That cooling seen across the economy has helped to slow price growth since the rip-roaring rates of 2022. The caveats, though, contribute to the unmoving nature of inflation (especially core) that we are currently experiencing.
Overall, this report is not moving the needle on the Federal Reserve’s next interest rate decision. It is not necessarily a bad report – inflation looks to be cooling using twelve-month measures, which is a sign the Fed’s tightening cycle is garnering some results. But the road to price stability is proving to be long.