GDP looks better when you peel the onion
On April 27, we got the first estimate of real Gross Domestic Product (GDP) growth in Q1 2023 – the inflation-adjusted amount of goods and services produced. The economy grew at a 1.1% annual rate, down from 2.6% in Q4 2022.
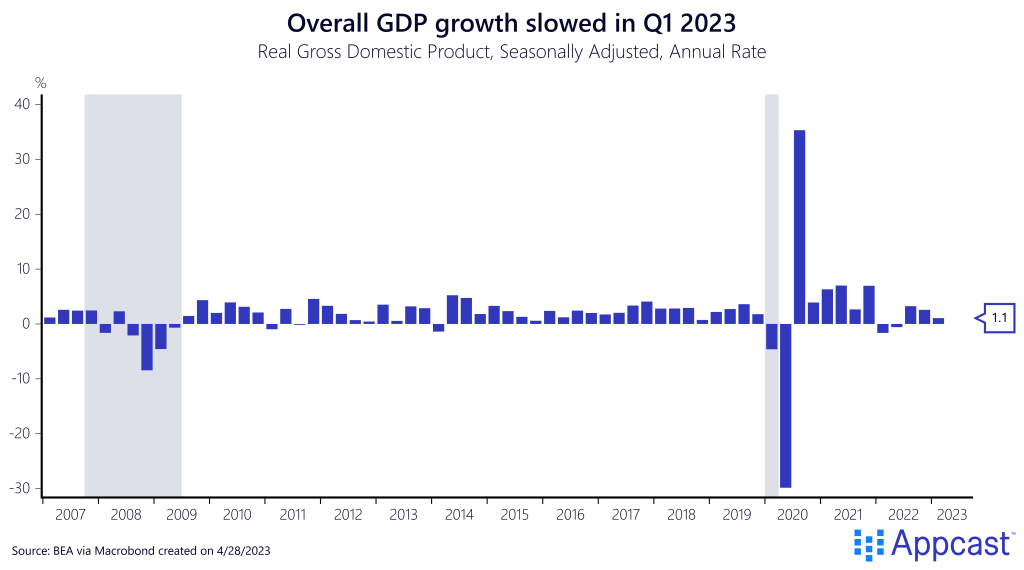
This slowdown from the prior quarter is better than it seems because of an inventory drawdown that shaved off around two percentage points of growth; and inventories (the stock of goods held by private businesses) have large swings quarter-to-quarter and don’t always represent underlying growth trends.
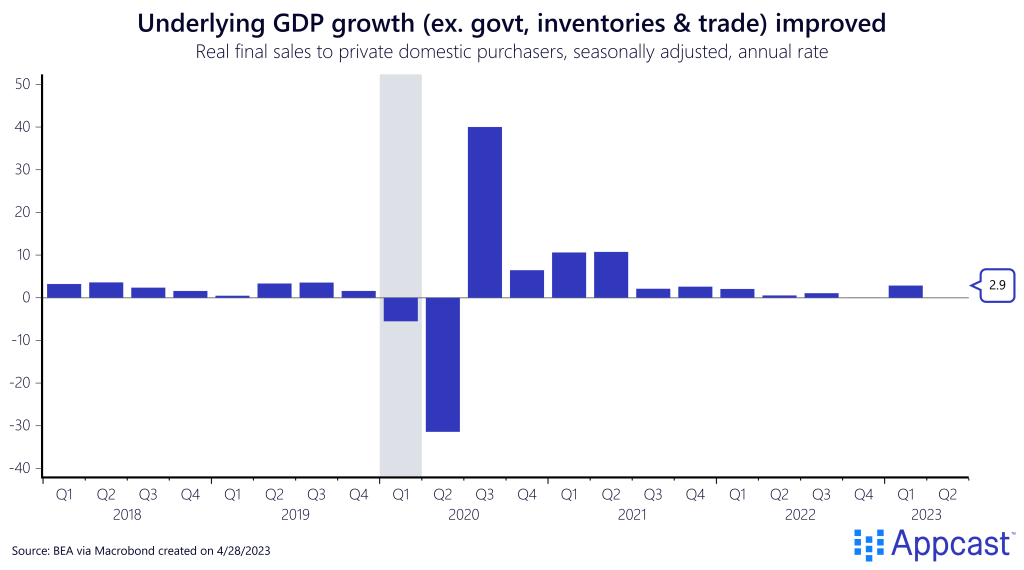
A more reliable gauge of underlying growth – real final sales to private domestic purchasers – strips out the volatile components of inventory changes, international trade, and government spending. Those categories are erratic; removing them leaves private-sector spending and investment, representing 89% of GDP ($17.9 trillion vs. $20.2 trillion). In Q1 2023, this metric increased at a 2.9% annual rate – the best since the spring of 2021, when the economy was booming out of the COVID recession.
What drove this better-than-expected underlying growth? Consumer spending, mostly. Focusing on just the consumption and investment components of real GDP, consumption of goods and services is doing the heavy lifting – contributing 2.5 percentage points of growth. Besides inventory swings, other negative drags came from residential investment (marking eight straight quarters) and business investment in equipment.

How can consumers continue to spend in the face of inflation?
This resilience in consumer spending is propping up an otherwise weakening economy, but how can consumers continue to spend so robustly while dealing with inflation and a tightening credit market? Well – wage growth continues to be very strong.
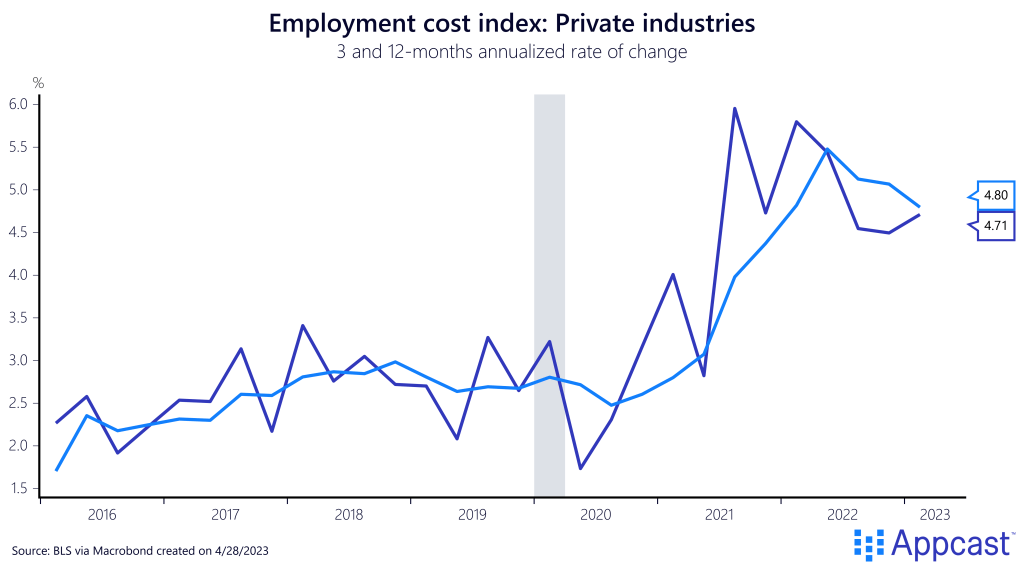
The first quarter Employment Cost Index (ECI) showed as much this morning – earning growth is not slowing but remains hot even as the rest of the economy sputters. The ECI is the most comprehensive measure of wage growth, as it adjusts for the composition of the workforce. While the ECI was slowing over twelve months, looking at the three-month annualized rate shows more trouble. The three-month percent change at an annualized rate was at 4.7%, indicating that the upward pressure on wages was strong last quarter. This will worry the Fed.
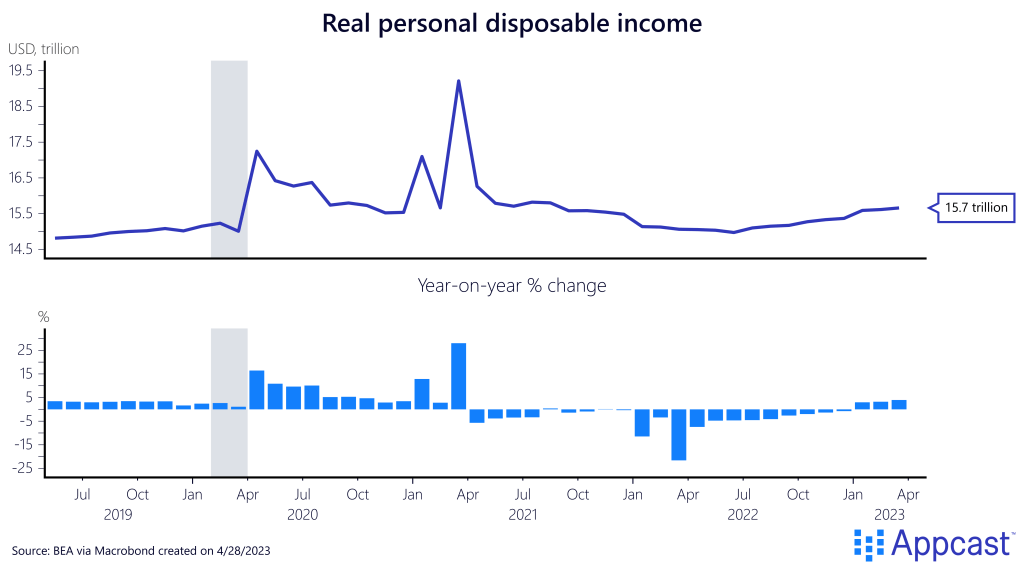
Workers’ real disposable income also showed signs of increasing last month, at $15.7 trillion up 0.2% from the month before.
What does this mean for the Fed?
While the slowing in GDP growth may have been a positive sign that the Federal Reserve’s tightening strategy is working, Fed officials will not be excited to see the underlying strength in consumer spending. Strong wage growth has long worried the Fed and the ECI’s quarterly increase will add to that pressure. Cooling an economy fueled by hot wage growth (and therefore, strong consumer spending) is proving difficult.
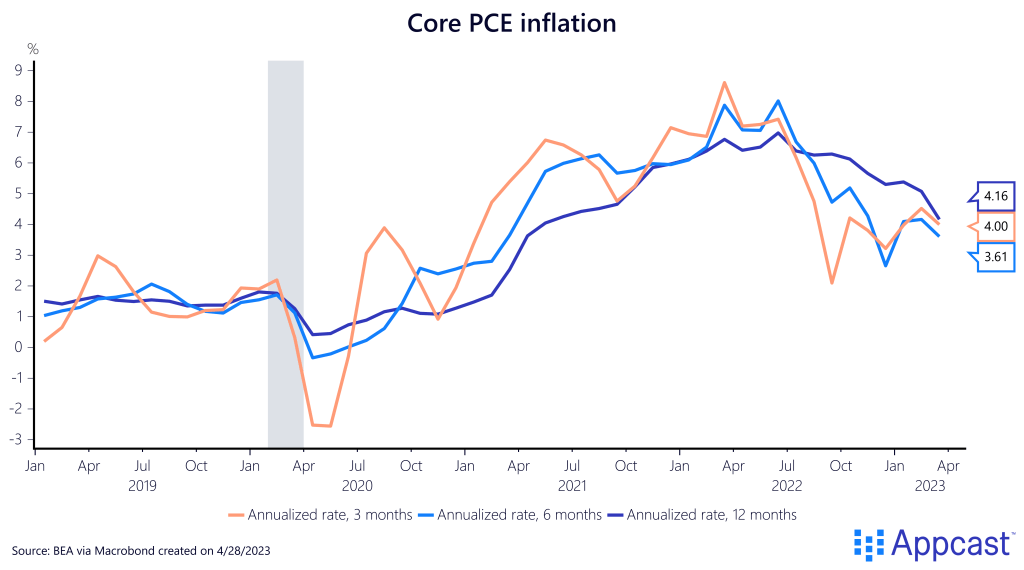
And inflation remains far above the 2% target, no matter how you slice it. The personal consumption expenditure index (PCE), the Fed’s preferred gauge of inflation, was up 5.0% from the year before in March. Core PCE inflation, stripped of volatile food and energy prices, was up 4.6% year over year. Core PCE is trending down, with a twelve-month annualized rate of 4.16% in March. The six- and three-month annualized rates have rebounded in the first quarter – inflation is slowing but not as quickly as the Fed would like to see.
The tight labor market is simultaneously a lifeboat for an otherwise sinking economy and a bane for the Federal Reserve and its goal of price stability. Strong consumer spending has protected economic growth but is also contributing to uncomfortable inflation dynamics.
Co-Author: Liz Anderson

