


The labor market is the backbone of the U.S. economy, with more than 158 million employed workers. Understanding employment trends is not just crucial for understanding the economic outlook, it also helps recruiters to gain insights into their specific sectors and general hiring trends, whether it is currently easy or hard to find workers, and at what cost.
In the United States, two primary surveys provide insights into the labor market: the payroll establishment survey (Current Employment Statistics, CES) and the household survey (Current Population Survey, CPS). Conducted by the Bureau of Labor Statistics (BLS). These monthly surveys differ significantly in their methodology, coverage, and the type of data they collect, yet both are essential for providing a comprehensive view of employment.
Usually, these two surveys show similar trends. But as of last year, an extremely large gap has opened. The payroll survey shows a rapidly growing labor market with large employment gains, while the household survey shows job losses since the end of 2023!
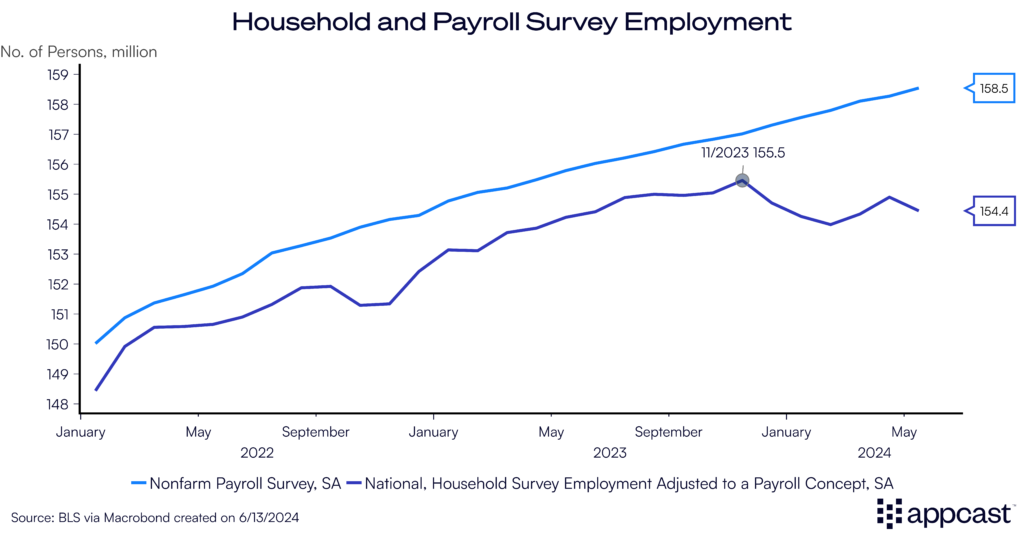
It is therefore crucial to understand the differences between the two data surveys, what their respective strengths and weaknesses are, and which data point we should trust more to determine the labor market’s actual performance right now.
The payroll survey gathers data from approximately 119,000 businesses, covering about 629,000 worksites. It focuses on employment, hours, and earnings of non-farm payroll employees, offering detailed industry-specific data on the number of jobs in the economy.
In contrast, the household survey samples around 60,000 households. It measures the employment status of the civilian non-institutional population aged 16 and over.
Here are the key differences:
- Survey Populations: The payroll survey samples businesses and government establishments, while the household survey samples households.
- Jobs vs. People: The payroll survey counts jobs, not workers. Multiple job holders will show up twice in the payroll survey but only once in the household survey.
- Agriculture and Self-employed: The payroll survey does not include agricultural workers and self-employed individuals, while the household survey includes both.
- Informal and Gig Economy: Growth in informal or gig economy jobs is better captured by the household survey.
- Business Openings and Closures: New businesses and startups might be underrepresented in the payroll survey initially but captured in the household survey as individuals report their employment status.
- Sample Size and Design: The payroll survey has a larger sample size and is less prone to sampling error, making it more stable month-over-month than the household household.
- Response Accuracy: Self-reported data in the household survey can be subject to misreporting or misunderstanding of employment status, whereas payroll data is based on actual payroll records from employers.
- Population benchmarking: The payroll survey employment estimates are benchmarked to the unemployment insurance tax records. This yearly process anchors the payroll employment numbers to the comprehensive count of all nonfarm payroll employment. The household survey is benchmarked only once a decade to the decennial census, resulting in a less precise employment measurement than the payroll survey.
These differences in scope and methodology therefore mean that each survey captures unique aspects of the labor market, and occasionally, their results may diverge.
Economists rely on the household survey for metrics like the unemployment rate, employment rate, participation rate, etc, and find it valuable for statistics on different subgroups of the population (by age, gender, ethnicity, etc.).
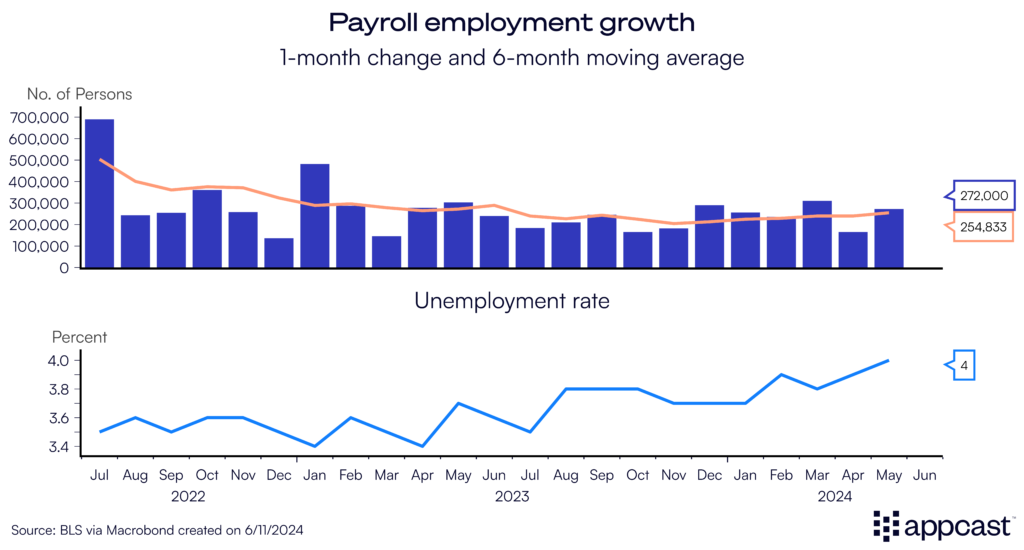
When it comes to monthly job creation, and wage dynamics, economists usually rely on the payroll data. The larger sample size and smaller data revisions are part of the reason why.
Net migration is a challenge for household survey
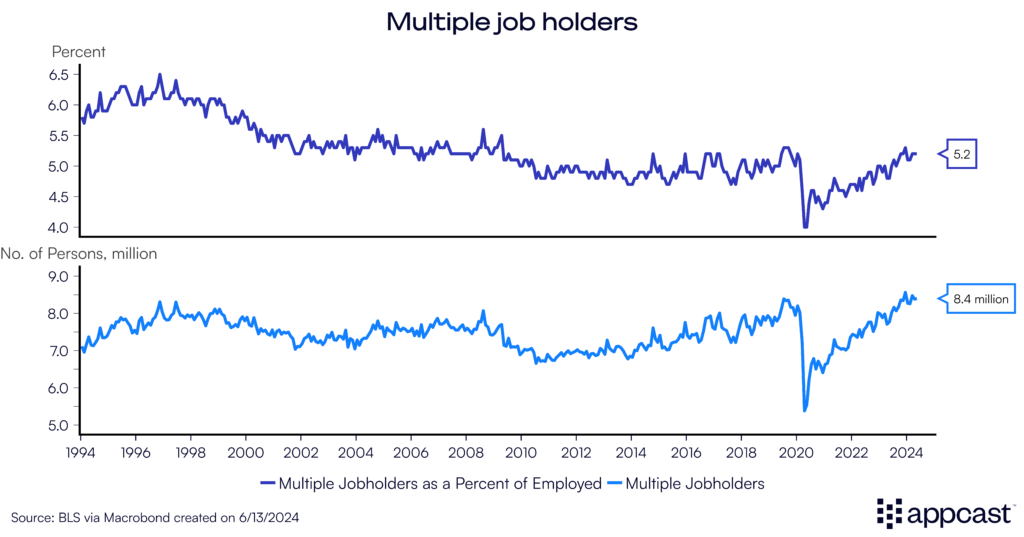
Since the payroll survey counts jobs instead of workers, some have argued that job growth is only so high because workers need to have two jobs to get by. However, labor market data shows that the percent of multiple job holders is historically low.
The main reason why the household survey might be off is due to the surge in migration that the U.S. experienced in 2023.
In a press conference earlier this year, Fed chair Jerome Powell acknowledged that the U.S. labor market and economy were booming thanks to an increase in labor supply driven by immigrants.
There is a precedent for the household survey to underestimate job growth. In the late 1990s, illegal immigration into the U.S. surged during a time when the economy was doing great and the labor market was booming, not unlike today. Back then, a big gap emerged between the payroll survey and household survey estimates for job growth. After the 2000 census captured the immigration increase, the BLS concluded that the employment based on the household survey was understated by about 1.6 million people.
If that sounds familiar, it’s because we are facing a similar situation right now. The census data shows a 0.5 percent increase in the U.S. population for 2023 while CBO (Congressional Budget Office) economists have estimated that the true number might be closer to 1%. They believe that the U.S. received about 3.3 million migrants on a net basis last year.
Undocumented migrants are less likely to participate in household surveys due to fear of exposure or deportation. This will lead to underreporting in the household survey. Employers, on the other hand, may still report these jobs in the payroll survey.
Furthermore, the household survey uses outdated population estimates that do not take the recent migration surge into account. It will therefore underestimate total employment.
Research shows that the payroll data is the more accurate in terms of job growth dynamics. A rule of thumb suggests putting 80% weight on the payroll data and 20% on the household survey to estimate employment trends.
While it is totally plausible that the payroll data is currently overstating job growth and we might see some negative revisions in the future, such a change would not dramatically alter our assessment of today’s labor market, which is that the U.S. economy has outperformed and added significantly more jobs than expected.
Back in 2022, it was estimated that the “breakeven rate” – the pace of job creation needed to keep the unemployment rate steady with a growing labor force – might just exceed 100,000 jobs per month. In reality, the U.S. has added more than 250,000 payroll jobs per month since then, and the unemployment rate has edged up regardless. This is entirely due to the unexpected surge in labor supply thanks to migration. While the precise figure is unknown, we do have a “guesstimate” from the CBO that seems to be in the right ballpark.
What does that mean for recruiters?
Economic data can be puzzling. Two different employment measures in the U.S. show vastly different things. It is important to understand what drives this divergence and which measure is closer to the truth in order to correctly assess the labor market.
Economists are mostly in agreement that the payroll data is the more accurate measure right now (and historically). The household survey is based on outdated population estimates and does not account for the recent surge in U.S. migration, which can explain why the unemployment rate has edged up even as the U.S. has continued to add jobs at a rate of close to 250,000 per month.
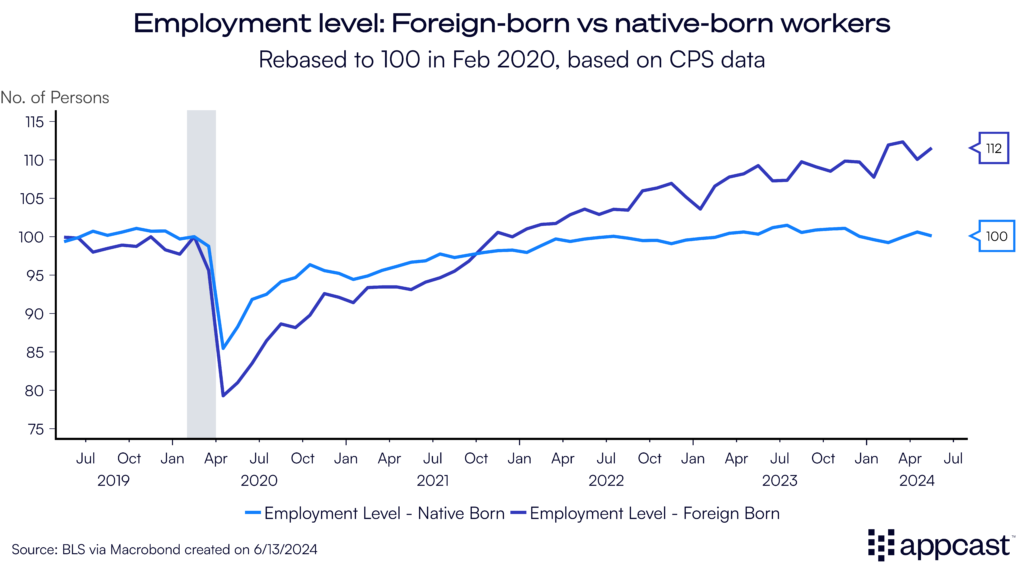
The unexpected increase in labor supply is part of the reason why the U.S. economy has outperformed other advanced economies. Even as domestic workers are leaving the workforce en masse because of aging (the Baby Boomers retirement surge has not gone unnoticed), employment growth has continued to stay positive because foreign-born workers account for most of the job creation since 2020.
For recruiters, the surge in labor supply means that hiring has become somewhat easier, and that the labor shortages that we have experienced in 2021 and 2022 are currently not as severe as we had feared. Recruitment costs, measured by cost-per-applications, are falling across all sectors because economy-wide demand is normalizing while labor supply is increasing at the same time, thus creating a more balanced labor market.