


Author: Sam Kuhn and Ada Acker
Economy-wide breakdown:
- The U.S. labor market has shrugged off the worst predictions of the immediate tariff impacts as employment growth averaged 150,000 per month over a three-month average. Yet, when you look under the hood, warning signs emerge: healthcare and leisure & hospitality own the bulk of job growth while all other major sectors are either flat or have contracted.
- The unemployment rate fell slightly to 4.1% in June, but due to an unfavorable reason: the labor force has begun to contract. In May, 625,000 workers left the labor force. Then the labor force contracted again by 130,000 in June. The shift in U.S. immigration policy has started to materialize throughout the job market, potentially signaling renewed labor shortages.
- On the trade front, a new major trade deadline has been announced: come August 1st, a new set of reciprocal tariffs will be enforced unless a deal with that country has been struck. Policy uncertainty remains elevated, which is souring the mood of consumers and businesses. Until clarity is given on the final path of trade, it is likely that volatility will persist in financial markets, risking bleeding into the broader economy.
- On July 4th, the One Big Beautiful Bill Act (OBBBA) was signed into law marking a significant change in fiscal policy: tax cuts for both businesses and households, boosted funding for immigration enforcement, and reductions in spending for Medicaid and SNAP. Each one of these provisions can alter the difficulty of recruiting by industry, depending on the type of workforce. TK: Read more from our Chief Economist Andrew Flowers to learn more.
Read our economy-wide breakdown of the latest numbers.
Employment Trends
With policy changes and new tariff agreements still up in the air, uncertainty continues to impact the labor market. The finance and insurance sector maintained relatively normal job growth through the first wave of tariffs; however, other areas of the economy may imply weakness on the horizon.
The United States dollar has been on the decline since the beginning of 2025, with the U.S. dollar index down 10% since the beginning of the year—in part due to foreign investors turning away from the U.S. after tariff announcements. The weakening of the U.S. dollar historically could lead to more cautious spending and consolidation, slowing the job market and reducing growth. Yet, that has not significantly materialized in the labor market or macroeconomic data.
Finance and insurance job growth trended downwards in Q2 after a relatively strong start at the beginning of the year. May saw a positive jump in employment, but average growth in the past 3 months came in at just 1,900 jobs added per month.
Overall, finance and insurance job growth remained low across its subsectors. The securities & commodities subsector remains the strongest in job growth, with 2.4% year-over-year growth. Real estate saw a positive change in employment up to 1.1%, continuing to crawl back from a recent low at the end of 2024. Insurance carriers job growth remained stagnant, coming in at just 0.01%. Similarly, credit intermediation remained negative at –0.4%, though growth appears to be trending upwards in this subsector.
Wage Trends
Wage growth continued to cool across the subsectors, with the exception of securities & commodities, which saw positive wage growth up to 4.6%. Insurance carriers wage growth trended downwards but remained relatively high at 2.6%. Credit intermediation wage growth remained the highest in the sectors, with a slight decrease to 5.7% annual growth. Real estate, on the other hand, continues to see declining annual wage growth, falling to just under 0.3% in June.
Openings and Turnover Trends
Slow but positive job growth across finance and insurance led to a similar trend in hires, which ticked up at the start of Q2 and held steady at 2.2% in June. Job openings continued to see volatility but ended the quarter increasing to 4.5%. Meanwhile, voluntary quits increased this quarter to 1.3% and layoffs ticked up to 0.6%.
Recruitment Marketing Trends
The term “Long” or “ATS Apply” refers to the conventional application process, requiring applicants to manually submit their tailored application documents and personal details through the company’s website or an applicant tracking system (ATS). In many cases, applicants are required to create a company-specific account.
On the other hand, “Easy Apply” refers to a swift application process on a job board, often conducted through a smartphone. With a single click, essential information like the resume is transmitted directly to the company. Due to the simplicity of this application method, easy-apply metrics are not directly comparable to those of the long or ATS apply. The metrics are therefore presented separately.
Long Apply
Recruiting costs differed across finance and insurance, but the sector saw increasing recruiting costs overall. Recruitment costs in finance continued to rise over the course of Q2, with the median cost-per-click (CPC) increasing to $1.46 while the median cost-per-application (CPA) decreased slightly to $13.84.
Recruiting costs for insurance also rose in Q2 overall. CPC slightly increased at the beginning of the quarter; however, it decreased to $1.00 in June. The median CPA for insurance continued to rise, coming in at $15.86, while apply rates across both finance and insurance declined—with finance dropping to 9.8% and insurance to 7.3%.
Easy Apply
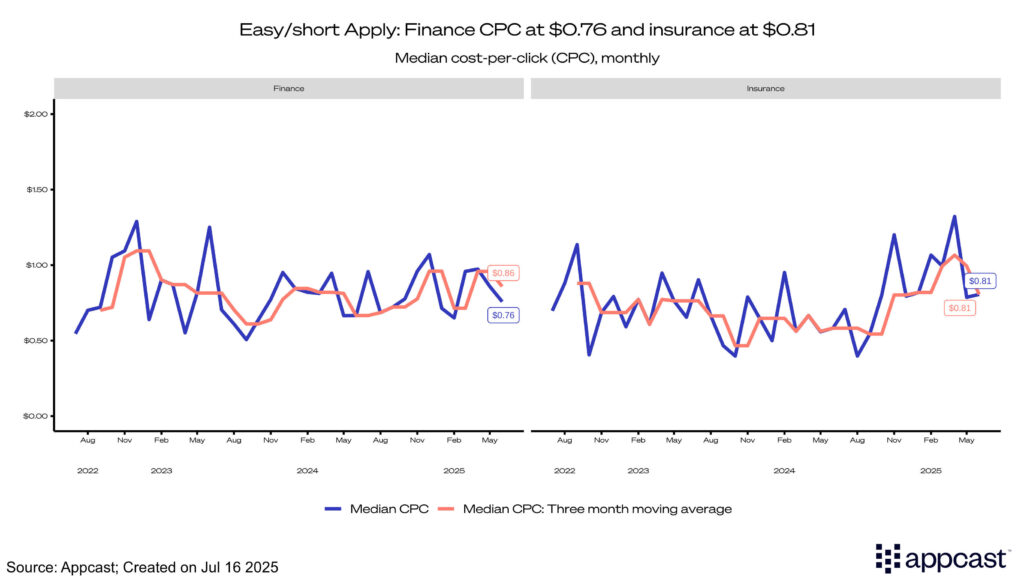
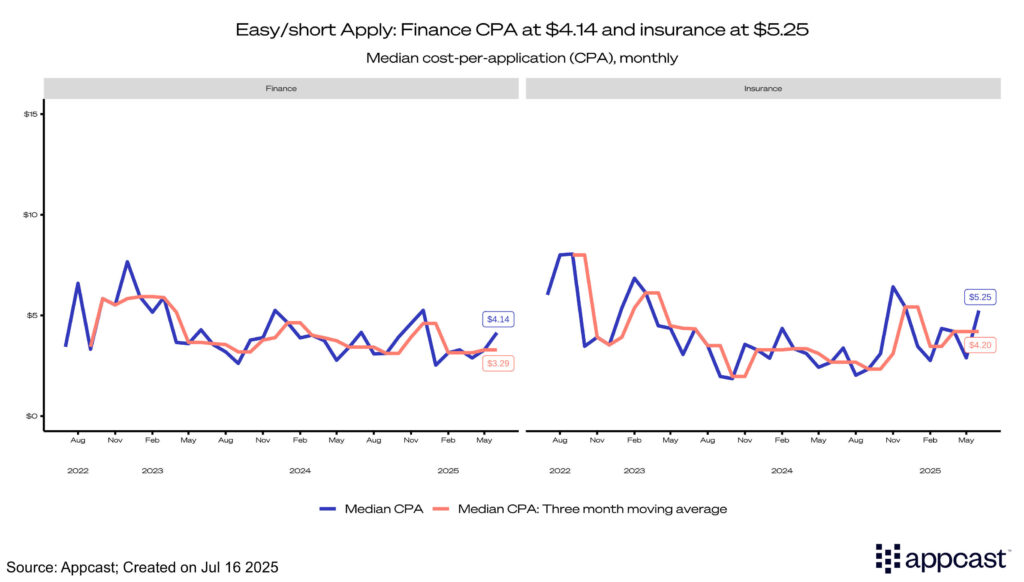
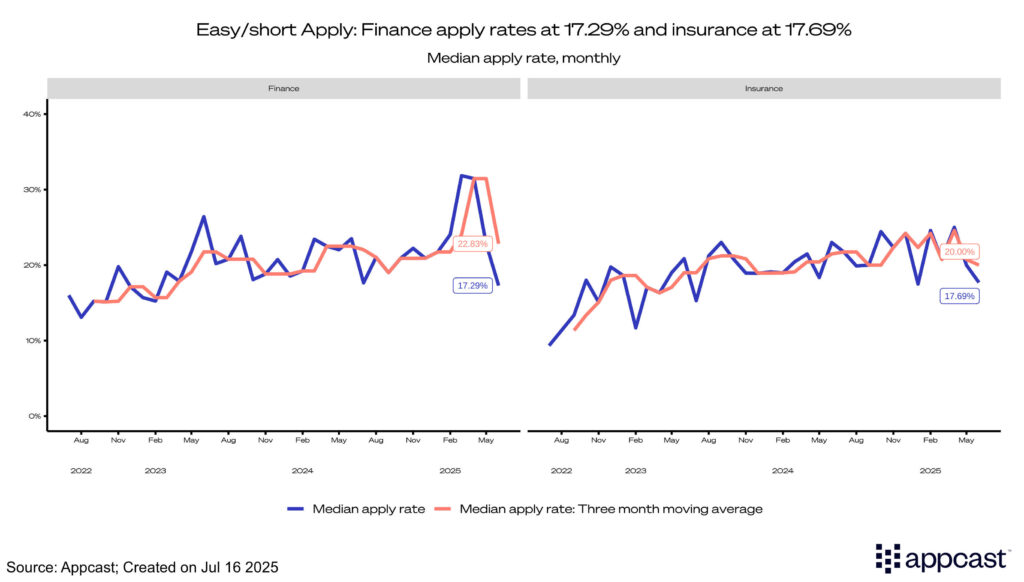
Easy apply CPCs for both finance and insurance decreased over the quarter, with finance ticking down to $0.76 and insurance to $0.81. Finance and insurance also mirrored each other in CPAs, with both seeing similar increases to $4.14 and $5.25, respectively. Apply rates in both finance and insurance dropped to just over 17%, with the apply rate for finance dropping by nearly 15% in Q2.
Recruitment Marketing Forecast
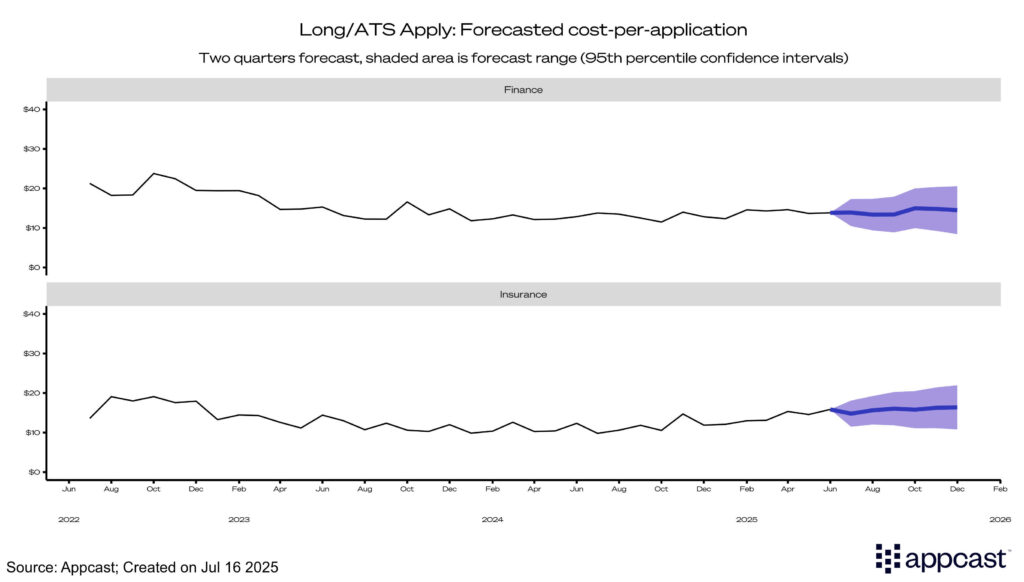
Based on historical CPA data, our forecast predicts that recruiting costs for both sectors will remain stable, with CPAs for finance remaining in the $11 to $14 range and insurance remaining a little higher in the 13$ to $16 range for the rest of the year.
What does this mean for Finance and Insurance?
The finance and insurance industries are known for volatile business cycles that persist in 2025. Tariff shifts have exacerbated that volatility, influencing short-term hiring demand while frequent changes and backtracking on those tariffs continue to drive uncertainty. Recruiters should expect to see similarly slow job growth as turbulent recruitment costs trend slightly upwards to finish out the year.
Forecasting Methodology
Cost-per-application (CPA) is forecasted one year ahead using the previous two years’ worth of one-month moving average data. A combination of ARIMA, exponential smoothing, and seasonal naïve models are used to create an ensemble forecast. The forecast provides the 95th percentile confidence interval, indicating the likelihood that each value will be within the CPA range provided.