Data revisions to the US jobs data can be large
Former Fed chairman Ben Bernanke published a fascinating memoir a few years ago about his experience during one the most difficult times in recent U.S. history – the financial crisis of 2008.
While the Fed was able to prevent the U.S. economy falling into a Great Depression scenario with unemployment rising to almost 25%, financial conditions still spiraled out of control. This was enough to put millions of Americans out of a job and led to an increase in the unemployment rate all the way to 10% during the Great Recession.
In retrospect, Bernanke regrets that the Fed didn’t even do more to support the economy throughout 2008. However, he also faced some formidable opposition with many Fed governors at the time being more worried about inflation than job losses (2008 saw a spectacular increase in oil and food prices).
An additional problem at the time was that the initial jobs data came in much better than what the actual, revised data would show one year later. In fact, this is a common problem with some macroeconomic data. One reason why economists cannot forecast recessions is that contemporary data often gets revised significantly after the fact.
One can see with the naked eye that there is a massive difference between the nonfarm payroll data that was initially published in 2008 and the revised data series from today.
The data available to the Fed at the time suggested that the U.S. economy had lost some 760,000 jobs between January and September of 2008, a very poor performance indicative of a recession. This should have prompted even more action from the Fed. However, today we know that the true extent of the job loss disaster was more than twice that high, closer to 1.64 million during the initial stage of the downturn.
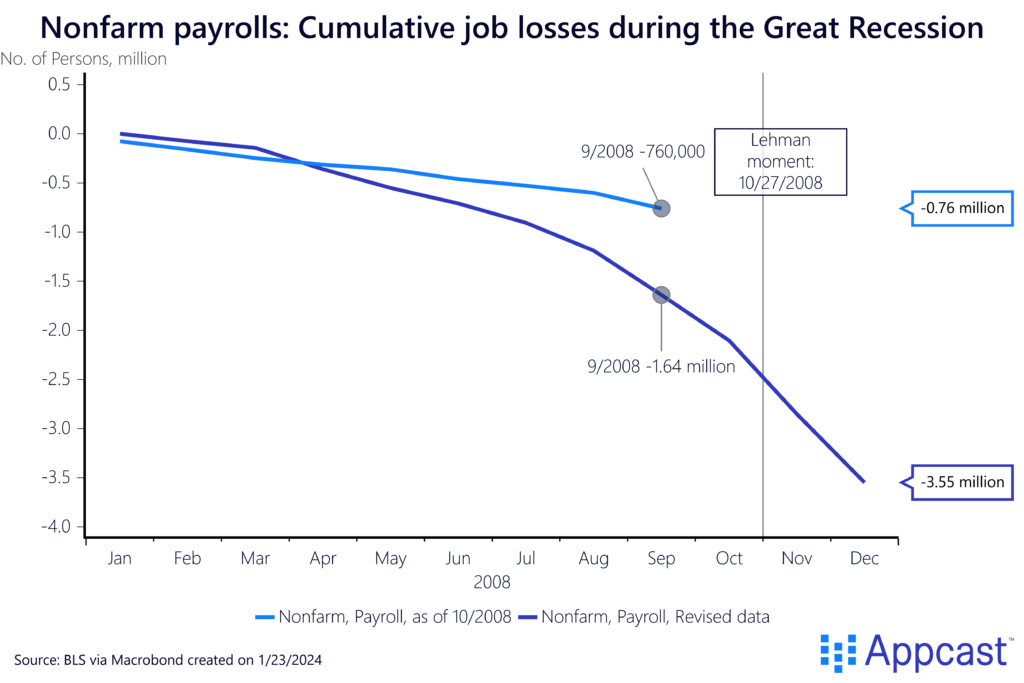
Over the course of 2009, another 5 million jobs would be lost, meaning that the Great Recession led to a cumulative employment loss of almost 9 million. And it would take until mid-2014 to gain all these jobs back.
Negative data revisions usually cluster during recessions
The chart below shows the initial data release for nonfarm payroll employment growth from January 2008 until January 2010 compared with how the revised data for job growth looks today. As one can see, the jobs data was revised down during every month between the period of January 2008 and January 2010.
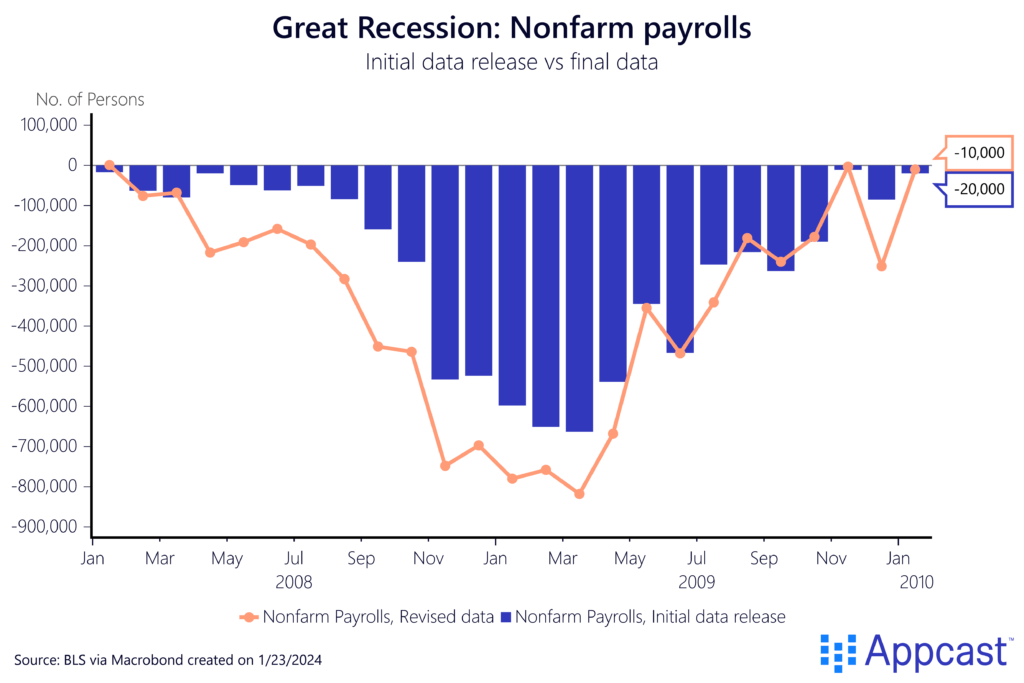
And this effect is not just specific to the Great Recession. In fact, negative job data revisions cluster during economic downturns. The initial data often is more upbeat than the revised data released months or even quarters later. This obviously poses a challenge to policymakers who are blind to the full extent of job losses in real time.
Positive revisions happen during labor market booms
Economic booms, on the other hand, are usually accompanied by positive revisions to the jobs data. The job recovery from the COVID-19 pandemic provides the best and most recent example. Most months between January 2021 and December 2022 saw significantly higher job growth than what the initial data release suggested. Some nonfarm payroll prints were revised upwards by several hundred thousand jobs later on, especially in 2022. Positive data revisions cluster during economic recoveries.
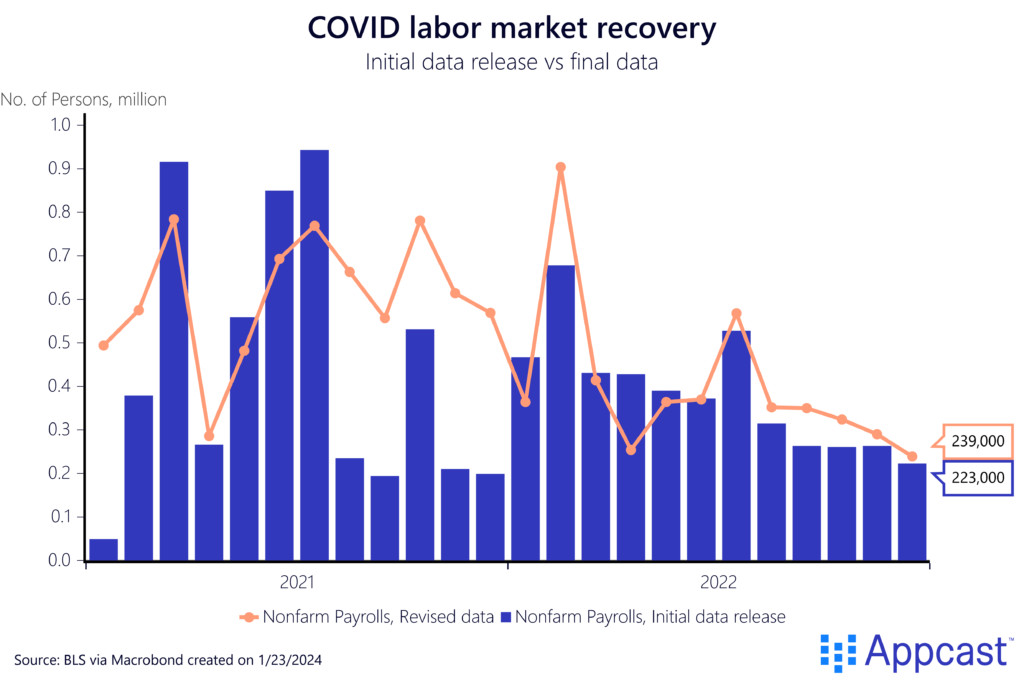
While this is positive for the job market, it poses a challenge for policymakers who might not become aware of an overheated labor market until after the fact.
Negative revisions throughout 2023 subtracted more than 440,000 jobs
There have been many signs that the U.S. labor market is cooling down after being in a state of overheating throughout most of 2021 and 2022. Job vacancies have declined substantially, job growth is slowing, and wage growth is coming down. The imbalance between demand and supply is normalizing. According to Fed governor Waller, the economic recovery and the labor market are on track for the so-called soft landing that some of us were hoping for.
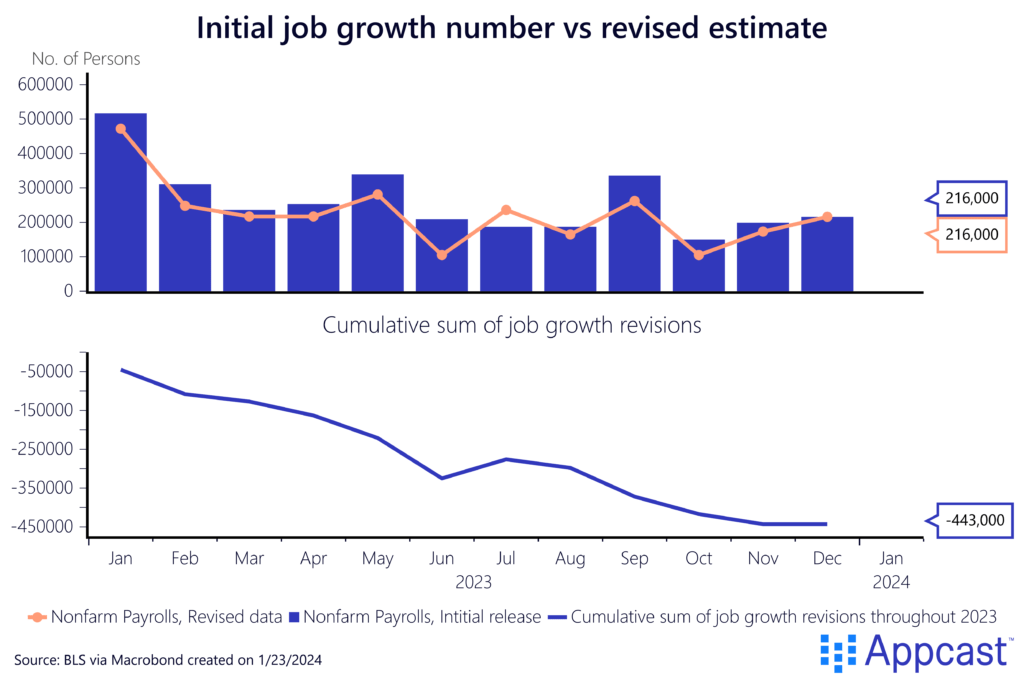
However, revisions have subtracted substantially from last year’s job growth. The U.S. economy added 2.7 million jobs last year, more than 220 thousand per month. But job growth would have exceeded 3 million if data revisions had not subtracted more than 440,000 jobs throughout 2023, and the December data has not been revised yet.
While it is completely normal for the labor market to normalize after being in a state of frenzy for more than a year, the clustering of negative revisions is something that policy makers should keep an eye on!
What does that mean for the US labor market in 2024?
We believe that the U.S. labor market is currently healthy. We are currently enjoying one of the longest spells of below-4% unemployment in recent economic history. The imbalance between labor demand and labor supply has been solved not by employment losses but by rapidly falling vacancies, just as some economists predicted back in 2022.
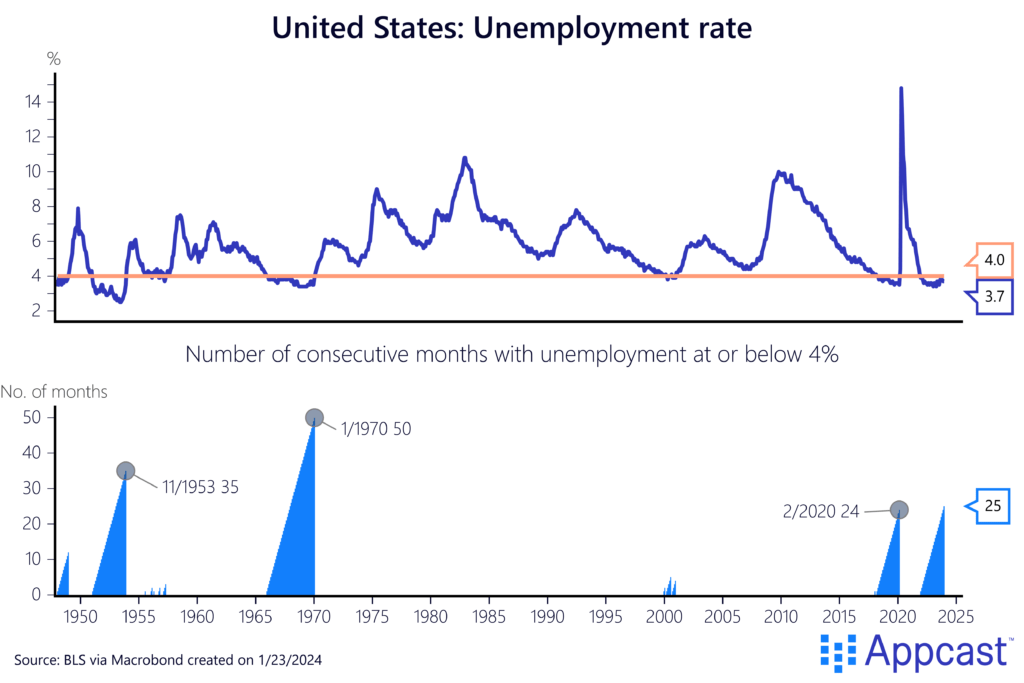
Moreover, due to adverse long-run demographic trends, the U.S. economy only needs to add less than half a million jobs per year, on average, to remain at full employment, according to the BLS.
There are no big warning signs that the U.S. economy is currently heading towards a recession. However, if the negative streak of revisions continues, the labor market might cool faster than what policy makers actually desire, surprising the Fed and ruining the soft landing.


