


Author: Sam Kuhn and Ada Acker
Economy-wide breakdown:
- The U.S. labor market has shrugged off the worst predictions of the immediate tariff impacts as employment growth averaged 150,000 per month over a three-month average. Yet, when you look under the hood, warning signs emerge: healthcare and leisure & hospitality own the bulk of job growth while all other major sectors are either flat or have contracted.
- The unemployment rate fell slightly to 4.1% in June, but due to an unfavorable reason: the labor force has begun to contract. In May, 625,000 workers left the labor force. Then the labor force contracted again by 130,000 in June. The shift in U.S. immigration policy has started to materialize throughout the job market, potentially signaling renewed labor shortages.
- On the trade front, a new major trade deadline has been announced: come August 1st, a new set of reciprocal tariffs will be enforced unless a deal with that country has been struck. Policy uncertainty remains elevated, which is souring the mood of consumers and businesses. Until clarity is given on the final path of trade, it is likely that volatility will persist in financial markets, risking bleeding into the broader economy.
- On July 4th, the One Big Beautiful Bill Act (OBBBA) was signed into law marking a significant change in fiscal policy: tax cuts for both businesses and households, boosted funding for immigration enforcement, and reductions in spending for Medicaid and SNAP. Each one of these provisions can alter the difficulty of recruiting by industry, depending on the type of workforce. TK: Read more from our Chief Economist Andrew Flowers to learn more.
Read our economy-wide breakdown of the latest numbers.
The state of U.S. manufacturing jobs has been a hot topic recently, with many policy changes taking effect in the past few weeks. President Trump plans to extend and revise the tariff rates on August 1st, aiming to increase domestic goods production and increase domestic job growth. Additionally, the passing of the One Big Beautiful Bill (OBBB) on July 4th includes a section stating that overtime pay will be deductible in the 2025 to 2028 tax years if the employee is eligible.
Overtime hours are a leading indicator of economic activity, and a steady decrease in overtime hours in manufacturing coincides with the decrease in employment change across the sector. The average weekly overtime has been on a steady decline since its post-COVID resurgence, dropping and remaining below pre-COVID levels. The average weekly overtime for nondurable goods steadied out at 2.8 hours after a recent decrease; meanwhile, the average overtime for durable goods is just barely higher at a steady 2.9 hours per week. With policy changes in overtime pay, we may see an increased interest in overtime paying positions, driving overtime hours and, consequently, job growth.
We have yet to see the positive impact of tariffs on job growth in the manufacturing sector. Employment growth continues to remain relatively low in manufacturing. The three-month average job growth decreased by 6,000 this quarter, settling at just below –4,600 jobs a month. Employment growth dipped back into the negative in May and June as the sector continues to be affected by elevated interest rates that may be discouraging manufacturers from investing heavily in talent and infrastructure.
Employment growth across the major subsectors remains stagnant with slight decreases in everything but machinery manufacturing, which has seen a slight uptick. Food manufacturing remains the only subsector with a positive rate, at 0.4% annual growth
Wage Trends
Wage growth remains quite high across all sectors, with computing and electronic product manufacturing seeing the highest wage increases of just over 10% annually. Although wage growth remains high, it continues to drop from its near-all-time high in 2024. Wage growth has declined over the past quarter, with all subsectors decreasing by over 1% annually. Machinery manufacturing took the biggest hit with a decline of just over 2% annually.
Opening and Turnover Trends
Job openings in manufacturing continue to decline since their COVID peak, dropping to just over 3% of total employment. Consequently, hiring also decreased in tandem to just over 2.4%. Voluntary quits continue to decline marginally, settling at just over 1.3%, while layoffs and discharges remained mostly stagnant with a slight decrease to just under 0.9%. Overall, competition for manufacturing workers steadied out in Q2.
Recruitment Marketing Trends
The term “long” or “ATS apply” refers to the conventional application process, requiring applicants to manually submit their tailored application documents and personal details through the company’s website or an applicant tracking system (ATS). In many cases, applicants are required to create a company-specific account.
On the other hand, “easy apply” refers to a swift application process on a job board, often conducted through a smartphone. With a single click, essential information like the resume is transmitted directly to the company. Due to the simplicity of this application method, easy-apply metrics are not directly comparable to those of the “long” or “ATS apply”. The metrics are therefore presented separately.
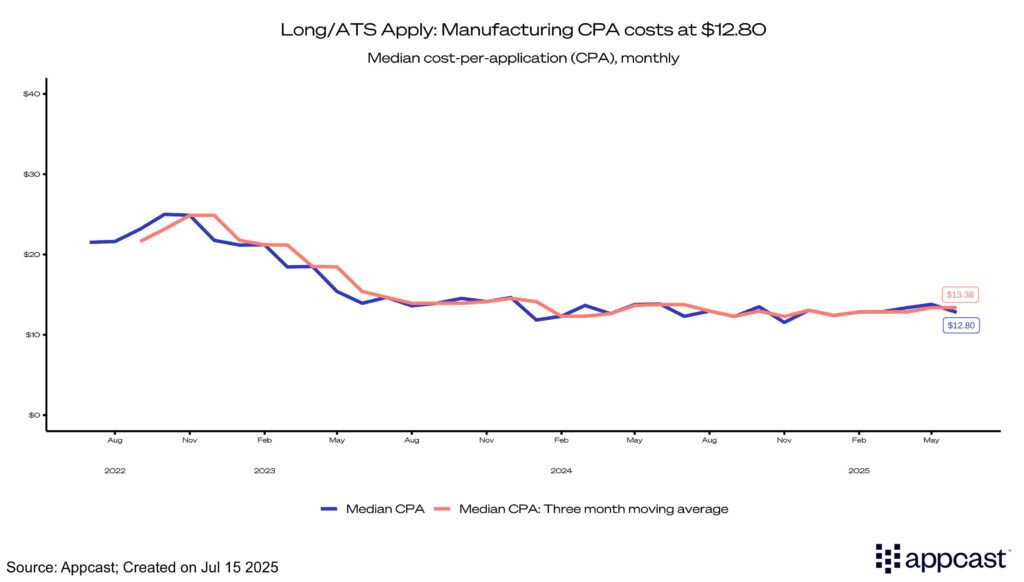
Long Apply
Due to slowing job turnover in Q2, manufacturing recruitment costs have seen only marginal increases and appear to remain relatively stable. Cost-per-click (CPC) increased slightly to $1.12, while apply rates are still on the rise at just under 9%. Cost-per-application (CPA) remained steady throughout the quarter as it has for much of the past year, hovering at just around $13.
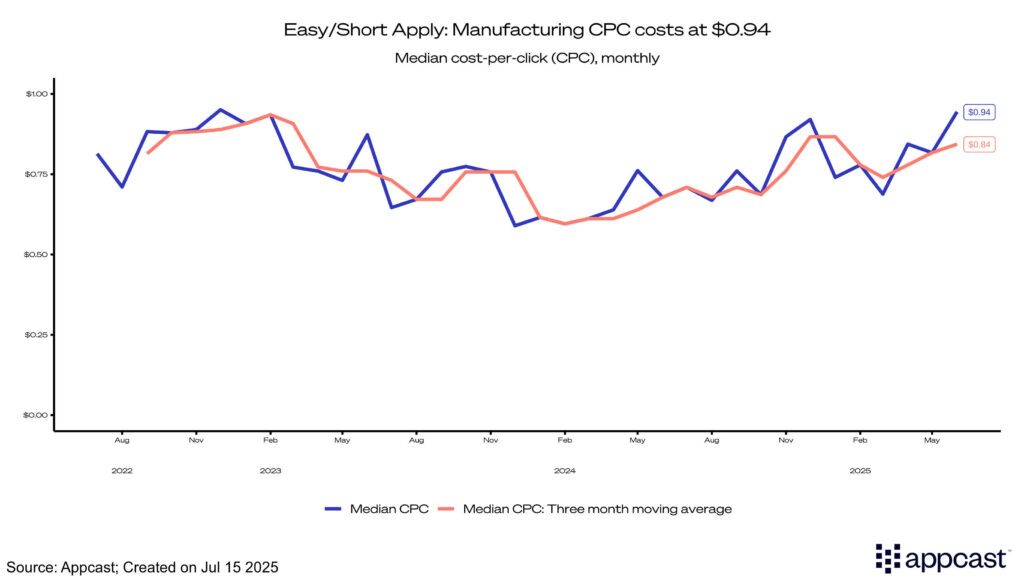
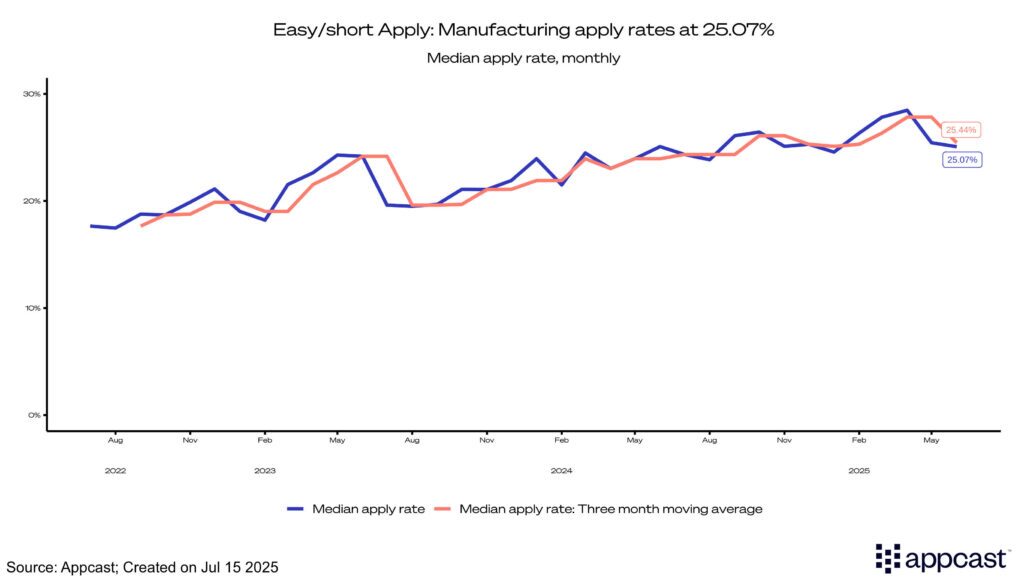
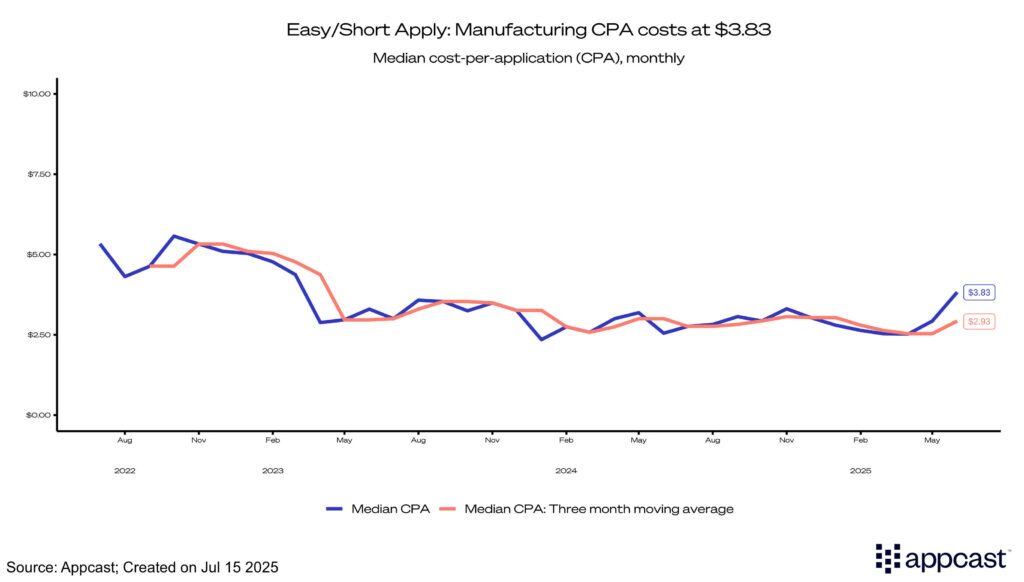
Easy Apply
Easy-apply costs have risen over Q2, with the median CPC increasing to $0.94and median CPA rising to $3.83. This increase coincides with a downtick in apply rates, coming in at just above 25%.
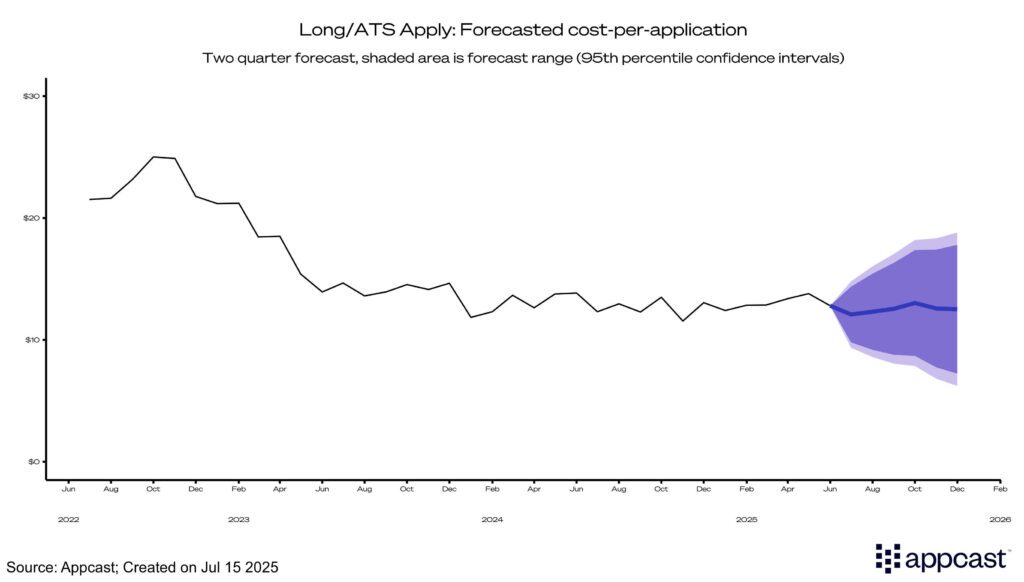
Recruitment Marketing Forecast
Recruitment marketing costs have decreased overall in the past four years, however, a slight uptick this quarter may suggest either a slowing of this trend with costs steadying out or potentially increasing over the rest of the year. Our forecast predicts that the CPAs will remain in the $10 to $13 range over the second half of 2025.
What does this mean for recruiting in Manufacturing?
With tariff revisions on the horizon aimed at prompting businesses and consumers to invest in domestically manufactured products by increasing the cost of foreign goods, we could see a significant increase in job growth. However, uncertainty around the duration and magnitude of these tariff revisions persists. Certain tax cuts and deductions passed in the OBBB could be seen as a push for greater job growth, with positions offering overtime pay possibly looking more attractive to potential candidates. Recruiters should expect a relatively steady flow of applications as well as elevated CPAs going into Q3.
Forecasting Methodology
Cost-per-application (CPA) is forecasted two quarters ahead using the previous two years’ worth of one-month moving average data. A combination of ARIMA, exponential smoothing, and seasonal naïve models are used to create an ensemble forecast. The forecast provides both the 95th percentile confidence intervals, indicating the likelihood that each value will be within the CPA range provided.