


Author: Sam Kuhn and Ada Acker
Economy-wide breakdown:
- The U.S. labor market has shrugged off the worst predictions of the immediate tariff impacts as employment growth averaged 150,000 per month over a three-month period. Yet when you look under the hood, warning signs emerge: healthcare and leisure & hospitality own the bulk of job growth while all other major sectors are either flat or have contracted.
- The unemployment rate fell slightly to 4.1% in June, but due to an unfavorable reason: the labor force has begun to contract. In May, 625,000 workers left the labor force. Then the labor force contracted again by 130,000 in June. The shift in U.S. immigration policy has started to materialize throughout the job market, potentially signaling renewed labor shortages.
- On the trade front, a new major trade deadline has been announced: come August 1st, a new set of reciprocal tariffs will be enforced unless a deal with that country has been struck. Policy uncertainty remains elevated, which is souring the mood of consumers and businesses. Until clarity is given on the final path of trade, it is likely that volatility will persist in financial markets, risking bleeding into the broader economy.
- On July 4th, the One Big Beautiful Bill Act (OBBBA) was signed into law marking a significant change in fiscal policy: tax cuts for both businesses and households, boosted funding for immigration enforcement, and reductions in spending for Medicaid and SNAP. Each one of these provisions can alter the difficulty of recruiting by industry, depending on the type of workforce. TK: Read more from our Chief Economist Andrew Flowers to learn more.
Read our economy-wide breakdown of the latest numbers.
Employment Trends
The many policy and tariff changes introduced by the Trump administration have caused economic uncertainty to weigh on many consumers. However, while consumers have become more pessimistic in 2025, their spending remains strong. Consumer spending and employment in accommodation and food services remain above pre-COVID levels, suggesting that consumers are continuing to spend their money on leisure and hospitality services.
After the decrease in employment at the beginning of the year, accommodation and food services started adding jobs again in Q2. However, growth has been on a downward trend through the quarter, with just 5,200 jobs added in June. With employers and jobseekers alike staying cautious as more policy changes are enacted, job growth remains slow in the sector.
Accomodation and food services employment remains uneven between the subsectors; however, all subsectors saw downward trends in job growth. Caterers & mobile food services continue to have the highest job growth in the sector; however, that growth did moderate to just under 7%. Hotels & motels also saw a slight decrease, dropping to 1.1% annual growth. Full-service restaurant employment growth remained stable with an annual growth of 0.5%. Drinking places also show cooling, with job growth slowing to 2.5%.
Wage Trends
Wage growth trended upwards in Q2 towards pre-pandemic levels. Wage growth at drinking places increased to 5.8% year-over-year, trending similarly to full-service restaurants which ticked up to 5.3%. Hotels & motels also saw positive wage growth, reaching 1.4% on the year. Caterers & mobile food services declined slightly to just under 3.6%.
Openings and Turnover Trends
Job openings have ticked down over the course of Q2—settling at 5.7%—while hires continued to rise, surpassing job openings and trending towards 6%. Voluntary quits also increased over the course of the quarter to 4.3% while layoffs remained low, decreasing slightly to 0.9%.
Recruitment Marketing Trends
The term “Long” or “ATS Apply” refers to the conventional application process, requiring applicants to manually submit their tailored application documents and personal details through the company’s website or an applicant tracking system (ATS). In many cases, applicants are required to create a company-specific account.
On the other hand, “Easy Apply” refers to a swift application process on a job board, often conducted through a smartphone. With a single click, essential information like the resume is transmitted directly to the company. Due to the simplicity of this application method, easy-apply metrics are not directly comparable to those of the long or ATS apply. The metrics are therefore presented separately.
Long Apply
Recruiting costs for food service and travel & tourism continue to diverge from one another, with food service seeing low, steady recruiting costs while the costs for travel & tourism continue to rise, showing much more volatility than food service.
Food service’s median cost-per-click (CPC) moderated over the course of Q2, seeing a slight dip at the end of the quarter down to $1.01. Conversely, travel & tourism saw a spike in CPC up to $1.27. Median cost-per-application (CPA) for food service remained relatively steady through Q2, decreasing minimally to $10.43 while CPAs for travel & tourism remain far more volatile. CPAs saw a sharp dip downward in June, dropping to just under $19.90. Apply rates for food service also moderated to just under 9.5%. Travel and tourism apply rates rose slightly, after a dip earlier in the year, to 5.9%. Increasing CPCs and CPAs paired with rising apply rates suggest an active, competitive recruiting market.
Easy Apply
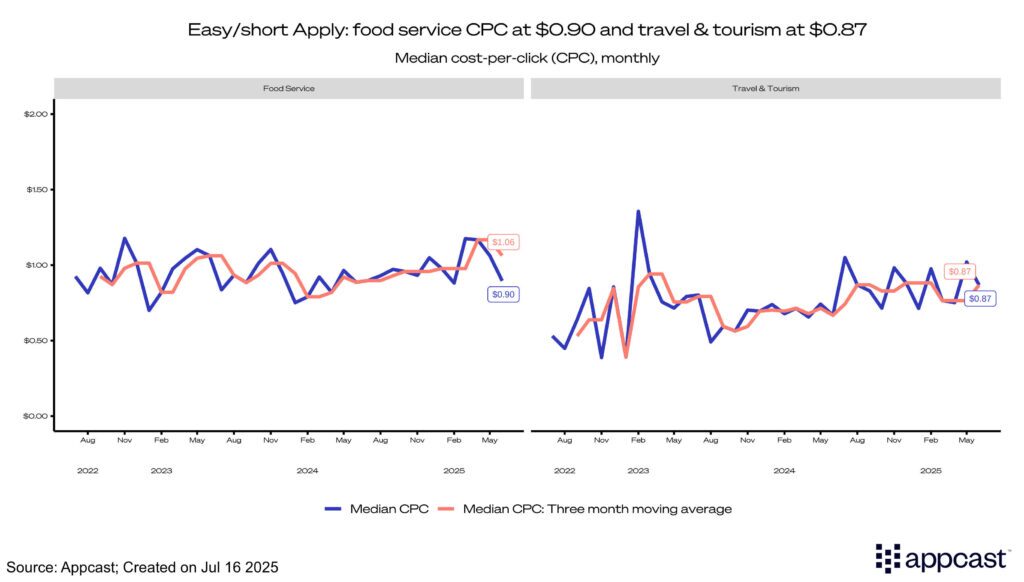
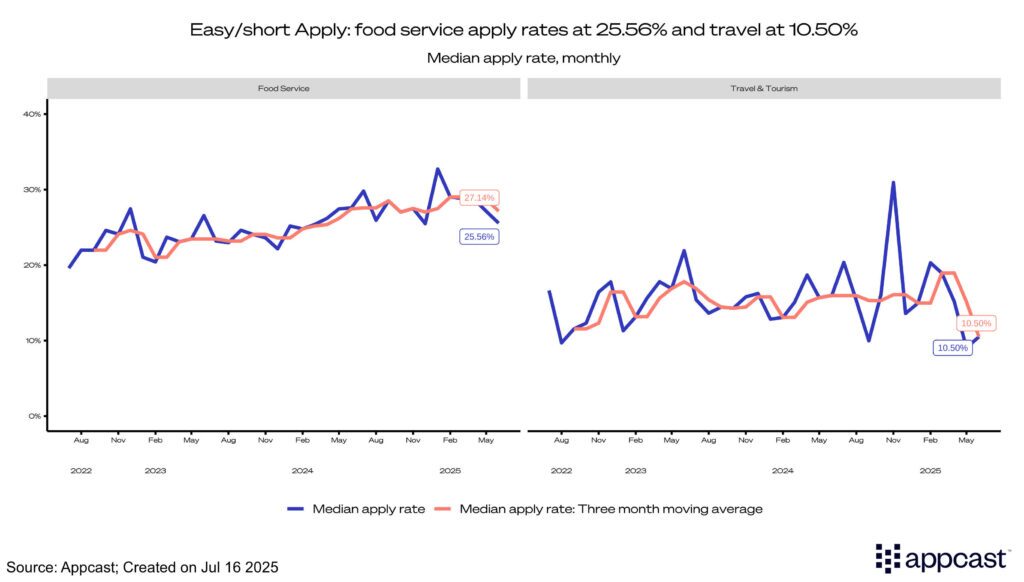
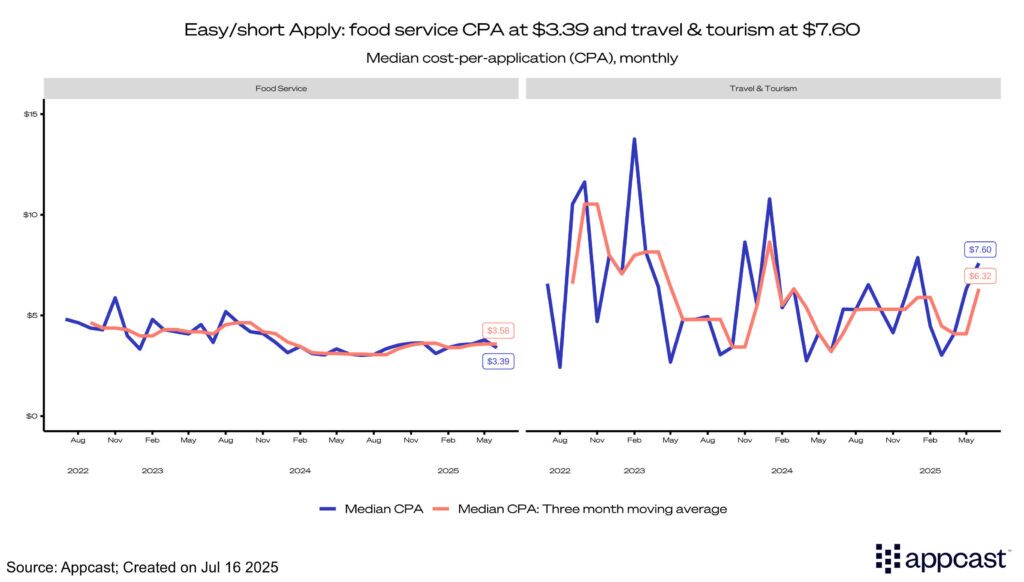
Easy-apply methods continue to see similar cost trends compared to traditional methods. CPC for food service fell to $0.90 and rose to $0.87 for travel & tourism. CPAs for food service remained steady, dropping minimally to $3.39, while travel & tourism saw a spike up to $7.60. The jump in CPA matched a decline in apply rates in travel & tourism, which dropped to 10.5% in Q2. The apply rate for food service also decreased over the quarter, coming in at 25.5% in June. Overall, easy-apply recruitment costs for food service declined while costs for travel & tourism increased.
Recruitment Marketing Forecast
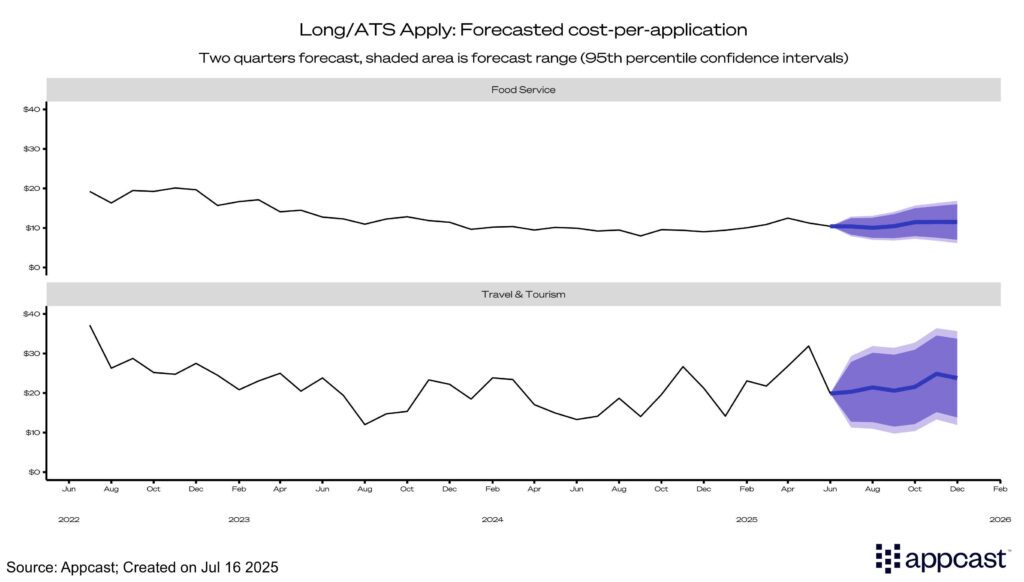
Using Appcast’s historical data, our forecast predicts that food service CPAs will remain in the $10 to $12 range while travel & tourism will continue to display more volatility, remaining in the $16 to $22 range.
What Does This Mean for Accommodation and Food Services?
Despite numerous policy changes, consumer spending has remained strong, supporting positive job growth in the accommodation and food services sector. While the travel & tourism industry continues to indicate volatile recruitment trends, food service has shown much more stability. Overall, labor market and recruitment trends suggest an increasingly competitive hiring environment. Recruiters should expect to see stable, slightly increasing recruiting costs and cooling job growth throughout the rest of the year.
Forecasting Methodology
Cost-per-application (CPA) is forecasted two quarters ahead using the previous two years’ worth of one-month moving average data. A combination of ARIMA, exponential smoothing, and seasonal naive models are used to create an ensemble forecast. The forecast provides both the 95t percentile confidence intervals, indicating the likelihood that each value will be within the CPA range provided.